Policy Spotlight: Public Debt Management in SADC
Public debt management is the practise of developing different strategies to measure and effectively manage national debt accrued by government and state-owned entities[36]. The process is meant also to provide policy or legal tools to monitor, evaluate and regulate the actions of politicians and government officials to ensure effective management of the government’s liabilities and financing obligations. The provision of public and up-to-date public debt management strategies informs lenders about government plans to ensure debt sustainability and reassures lenders, which also facilitates government’s borrowing from both internal and external sources. It is for this reason why SADC countries signed a Finance and Investment Protocol (FIP) in 2006 to tackle economic challenges such as inflation, public debt, budget deficits and current account balances through macroeconomic convergence[37].Annex 2 of the SADC FIP requires member states to manage public finances transparently, it also provides a set of criteria for monitoring and evaluating SADC member states’ performance in relation to macroeconomic convergence[38]. However, the current state of public debt and the economic crisis in some countries poses significant challenges for macroeconomic convergence targets. This is because many SADC countries are faced with high inflation rates, widening budget deficits and rising public debt levels[39]. The macroeconomic convergence target requires member states to maintain public debt valued at less than 60.0% of GDP[40]. The targets include a budget deficit less than 5.0% of GDP and an inflation target below 9.0%[41]. In addition to the macroeconomic convergence targets, member countries use different strategies to manage public debt.
In Zambia the public debt ceiling is set in nominal terms. The limit for domestic bonds is set at ZMK 40.0 billion and ZMK 30.0 billion for treasury bills[42]. However, the Zambian government does not set a target for external public debt[43]. The public debt ceiling is also not set in traditional terms as a share of GDP. Zambia has not performed well in terms of public debt management which is in part caused by the current insufficient public debt management strategy.
Table 4: Public Debt Management in Zambia
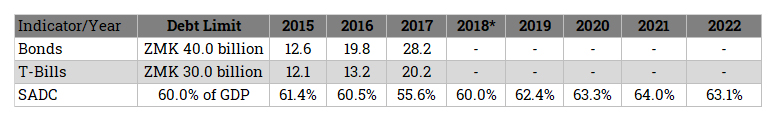
Source: IMF 2017b. Zambia 2017 Article IV Consultation, International Monetary Fund: Washington, D. C. Available At: https://www.imf.org/ [Last Accessed: 5 April 2019]; BoZM 2018. Bank of Zambia 2017 Annual Report, Bank of Zambia: Lusaka. Available At: https://www.boz.zm/ [Last Accessed: 2 April 2019].
In 2018, Zambian public debt increased to 60.0% of GDP from an average of 59.2% of GDP from 2015 to 2017[44]. An increase in Zambia’s public debt is attributed mainly to volatility in the ZMK-USD exchange rate and excessive government spending since 2012 that resulted in increased foreign borrowing[45]. Therefore, Zambia’s external public debt increased by 28.0% to ZMK 102.5 billion (approx. USD 9.8 billion) in 2018 compared to ZMK 80.1 billion the year before[46]. Despite having performed well according to its domestic targets, Zambian public debt exceeds the SADC debt limit and debt-servicing costs are becoming a fiscal strain. As a result, in 2018 public debt-servicing costs are projected to have increased to 22.3% of government revenue at ZMK 10.9 billion (approx. USD 1.0 billion)[47]. Debt-servicing costs have increased significantly from 15.3% of government revenue in 2015 to 21.9% in 2017[48].
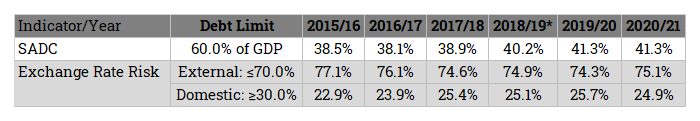
In Mauritius, the domestic public debt ceiling is 50.0% of GDP. Mauritius does not perform well in relation to its domestic target despite maintaining a dynamic public debt target. Public debt increased slightly to 63.9% of GDP in 2018 compared to the annual average of 62.1% of GDP from 2012 to 2017[49]. However, Mauritius has performed better than Zambia for debt servicing.
Table 5: Public Debt Management in Mauritius
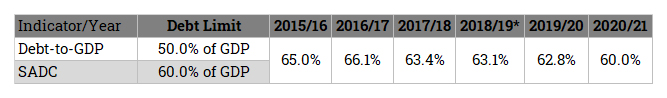
Source: MMoF 2015. Budget 2015/16, Appendix F: Debt, Mauritius Ministry of Finance: Port Louis. Available At: http://mof.govmu.org/ [Last Accessed: 25 March 2019]; MMoF 2016. Budget 2016/17, Appendix G: Debt, Mauritius Ministry of Finance: Port Louis. Available At: http://mof.govmu.org/ [Last Accessed: 25 March 2019]; MMoF 2017. Budget 2017/18, Appendix G: Debt, Mauritius Ministry of Finance: Port Louis. Available At: http://mof.govmu.org/ [Last Accessed: 25 March 2019]; MMoF 2018. Budget 2018/19, Appendix F: Debt, Mauritius Ministry of Finance: Port Louis. Available At: http://mof.govmu.org/ [Last Accessed: 25 March 2019].
Mauritius’ public debt servicing costs are projected to have constituted 11.4% of government revenue at MUR 13.4 billion (approx. USD 381.0 million) in 2018, which is a slight increase from the average of 11.3% of total government revenue from 2015 to 2017[50]. Although Mauritius has not performed well in relation to its domestic target, it is performing within the SADC macroeconomic convergence target. Mauritius is also in the process of reigning in public debt, despite it currently being valued above the domestic debt ceiling. Public debt should diminish over time because debt-servicing costs are mainly paid towards the principal debt and GDP growth performance has been positive in Mauritius.
Lastly, Tanzania takes a dynamic integrated approach to public debt management. This approach ensures that the country remains at low risk of external debt distress. Total public debt is projected to have increased to 37.3% of GDP in 2018, and maintained the constant average percentage (37.3%) of GDP from 2015 to 2017[51]. However, public debt-servicing costs have increased from an average of 22.6% of government revenue from 2015/16 to 2017/18, to 30.8% of in 2018/19 financial year[52]. The most notable thing is that, only 2.1% of total external debt-servicing was paid towards Tanzania’s principal public debt during 2018/19.
Table 6: Public Debt Management in Tanzania
Source: IMF 2017. Tanzania 2017 Article IV Consultation, International Monetary Fund: Washington, D. C. Available At: https://www.imf.org/ [Last Accessed: 15 February 2019]; MoFP 2017. Medium Term Debt Management Strategy, Ministry of Finance and Planning: Dodoma. Available At: http://www.mof.go.tz/ [Last Accessed: 15 February 2019].
The nominal targets for public debt management are mainly commended for assuring debt sustainability in the region. However, many countries compromise implementation of development projects due to limited financing. In addition, the traditional strategy of setting public debt at a certain percentage of GDP is important for controlling mounting public debt. Furthermore, making use of the debt-to-GDP ratio as it stands as a debt management strategy, might not be ideal as it permits countries to treat the 60.0% as the ultimate threshold, and does not adequately accommodate both developing and emerging economics, such as the SADC as a regional organisation. It does however, provide a benchmark that assists counties maintain the debt-to GDP ratio below the threshold to ensure that they maintain debt sustainability.
Despite its importance, this strategy is often taken lightly and does not inform budget allocations in many SADC countries e.g. Mauritius and Zambia. Tanzania is an example of how countries in the SADC can successfully maintain a low risk on external debt, and remain below the 60.0% threshold. By ensuring that the focus on public investment is prioritised by developing policies that have a strong macroeconomic management system by actively monitoring systemic risks, initiating a transition of the monetary framework towards an interest rate-based operating system and raising the resilience of the banking system though the of Financial System Stability Assessment[53]. While supported by comprehensive monetary and fiscal policies[54]. Furthermore, by attending to key gaps that pose a threat to the economic growth of the country. Such as major infrastructure development in the case of Tanzania, the standard gauge railway, the revamping of Air Tanzania and port expansion in Dar es Salaam, has increased the country’s debt in 2017, but will in the long run serve to boost the economy. Moving forward, SADC governments’ need to develop more defined public debt management strategies with various integrated and measurable targets that inform budgeting in order to ensure public debt sustainability.
By Xolisile Ntuli and Tsepiso Rantso
[36] Wheeler, G. 2004. Sound Practice in Government Debt Management, World Bank: Washington D. C. Available At: https://openknowledge.worldbank.org/ [Last Accessed: 3 February 2019].
[37] SADC 2012b. Macro-Economic Convergence, on the Southern Africa Development Community Website, viewed on 17 February 2019, from https://www.sadc.int.
[38] SADC 2016. Protocol on Finance and Investment, Southern African Development Community: Gaborone. Available At: https://www.sadc.int/ [Last Accessed: 12 February 2019].
[39] PESA 2018. Political Economy Review: Looming SADC Public Debt Crisis, on the Political Economy Southern Africa Website, viewed on 4 April 2019, from https://politicaleconomy.org.za/.
[40] SADC 2012b. Macro-Economic Convergence, ibid.
[41] SADC 2012b. Macro-Economic Convergence, ibid.
[42] ZMoF 2017. Medium Term Debt Strategy (2017-2019), Zambia Ministry of Finance: Lusaka. Available At: http://www.mof.gov.zm/ [Last Accessed: 3 February 2019].
[43] ZMoF 2017. Medium Term Debt Strategy (2017-2019), ibid.
[44] IMF 2018a. World Economic Outlook, ibid.
[45] LT 2018. In Search of Zambia’s Hidden Public Debt, on the Lusaka Times Website, viewed on 26 March 2019, from https://www.lusakatimes.com.
[46] IMF 2017b. Zambia 2017 Article IV Consultation, International Monetary Fund: Washington, D. C. Available At: https://www.imf.org/ [Last Accessed: 5 April 2019]; BoZM 2019. Monetary and Financial Statistics: Statistics Fortnightly Time Series, Bank of Zambia: Lusaka. Available At: http://www.boz.zm/ [Last Accessed: 5 April 2019].
[47] IMF 2017b. Zambia 2017 Article IV Consultation, ibid.; BoZM 2019. Monetary and Financial Statistics: Statistics Fortnightly Time Series, ibid.
[48] IMF 2017b. Zambia 2017 Article IV Consultation, ibid.
[49] IMF 2018a. World Economic Outlook, ibid.
[50] MMoF 2015. Summary of Expenditure by Votes, Mauritian Ministry of Finance: Port Louis. Available At: http://mof.govmu.org/ [Last Accessed: 5 April 2019]; MMoF 2016. Summary of Expenditure by Votes, Mauritian Ministry of Finance: Port Louis. Available At: http://mof.govmu.org/ [Last Accessed: 5 April 2019]; MMoF 2016. Appendix A: Revenue, Mauritian Ministry of Finance: Port Louis. Available At: http://mof.govmu.org/ [Last Accessed: 5 April 2019]; MMoF 2017. Summary of Revenue Projections, Mauritian Ministry of Finance: Port Louis. Available At: http://mof.govmu.org/ [Last Accessed: 5 April 2019].
[51] IMF 2018a. World Economic Outlook, October 2018, ibid.
[52] MoFP 2019. 2019 Budget Speech, Ministry of Finance and Planning: Dodoma. Available At: http://www.mof.go.tz [Last Accessed: 27 March 2019].
[53] IMF 2018e. Tanzania Financial System Stability Assessment, International Monetary Fund: Washington, D. C. Available At: https://www.imf.org/ [Last Accessed: 15 February 2019].
[54] IMF 2018f. IMF Executive Board Concluded the United Republic of Tanzania’s 2018 Financial System Stability Assessment, on the International Monetary Fund Website, viewed on 17 February 2019, from https://www.imf.org.
The April 2019 issue focuses on providing an overview of public debt in SADC and what needs to be done to retain debt sustainability in the future – Why do SADC countries raise public debt? What is the balance of revenue versus expenditure? What are the main sources of government revenue in SADC? What are the current average levels of public debt in SADC? Which are the most and least indebted countries? What is the regional public debt target or ceiling? How many countries comply? What options does this mean for the future of public debt sustainability in SADC? The PESA Regional Integration Monitor, Apr 2019 examines these questions.